Complete Clinical Chromosome Idiogram Inspector for Modern Cytogenetics
Visualizing human chromosomes at high resolution is a foundational requirement in clinical cytogenetics, prenatal diagnosis, oncology workups, and hereditary disease evaluations. While traditional static idiogram diagrams display standard band patterns, modern clinical practice demands interactive exploration: mapping patient copy number variations (CNVs), pinning pathogenic mutations, and cross-referencing reference gene loci against population databases.
Biogistry provides an interactive online chromosome idiogram visualizer designed specifically for clinical geneticists, genetic counselors, cytogenetic technologists, and medical researchers. Built to eliminate static reference lookup delays, our idiogram engine renders the complete 24-chromosome human karyotype (chromosomes 1 through 22, X, and Y) mapped against the GRCh38 genome reference assembly at 850-band ISCN resolution.
Every idiogram rendered in Biogistry strictly adheres to International System for Human Cytogenomic Nomenclature (ISCN) guidelines. From precise Giemsa stain shading intensity levels to centromere pinch boundaries and p/q arm ratios, our idiogram visualizer generates publication-ready graphics for electronic health records (EHR), multidisciplinary tumor board summaries, and clinical diagnostic documentation.
Dynamic Interactive Viewing Architecture: 24-Chromosome Grid vs. Single-Chromosome Focus View
The Biogistry idiogram visualizer features a dual-layer interactive layout. Clinicians can seamlessly transition between a complete 24-chromosome karyotype overview and a deep single-chromosome focus workspace.
| Viewing Mode | Primary Clinical Purpose | Display Features | Supported User Actions |
|---|---|---|---|
| 24-Chromosome Karyotype Grid | Genome-wide structural overview and multi-chromosome anomaly screening | Displays all 24 human chromosomes (1-22, X, Y) in proportional length cards with active variant indicators | Single-click chromosome card selection to jump into Focus Mode |
| Single-Chromosome Focus View | Sub-megabase breakpoint inspection, CNV mapping, and locus curation | Renders central 850-band chromosome body flanked by 6 parallel genomic context tracks | Drag-to-pan vertical scrolling, smooth zoom up to 800x, and interactive minimap navigation |
1. 24-Chromosome Karyotype Grid Overview
Upon opening the idiogram workbench, clinicians are presented with a clean grid displaying all 24 human chromosomes. Each chromosome card renders proportional band structures and displays indicator marks for any active patient variants or highlighted loci. Clicking any chromosome card instantly switches the interface into Focus View Mode.
2. Single-Chromosome Focus View Mode
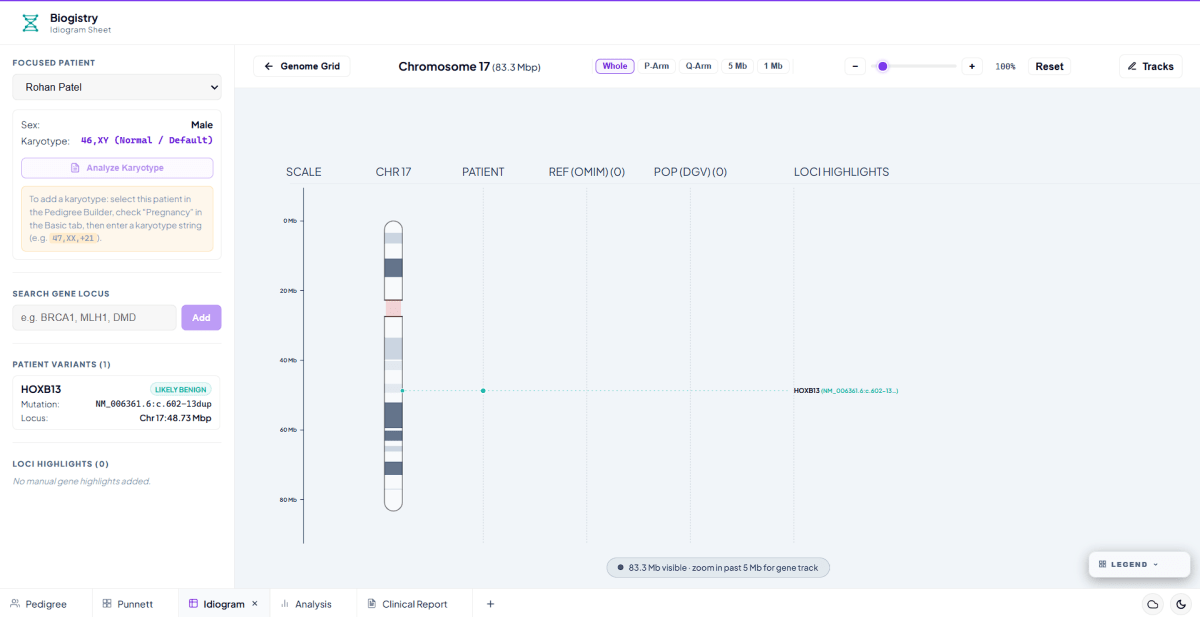
Focus Mode expands the selected chromosome into a comprehensive vertical viewing canvas flanked by synchronized genomic data tracks. Clinicians can pan and zoom across the chromosome length from whole-chromosome scale down to sub-megabase detail.
3. Ultra-High Precision Vector Zoom Engine
Standard browser graphics zoom tools scale all canvas elements uniformly, which can cause text labels, connector lines, and pin icons to enlarge uncomfortably and blur at high magnification levels. Biogistry solves this with an ultra-high precision vector scaling engine that decouples vertical genomic positioning from visual label rendering.
As you zoom into microdeletion candidate regions up to 800x magnification (80,000% scale), genomic coordinates expand smoothly while text callouts, connector lines, and variant pins maintain crisp, ultra-sharp typography and exact line weights. This ensures flawless visual readability whether inspecting an entire chromosome or zeroing in on a single 500 kb breakpoint.
6 Parallel Synchronized Genomic Context Tracks
Focus View Mode arranges six parallel genomic tracks alongside the central chromosome body to provide complete cytogenomic context:
[SCALE Mb RULER] ── [CHR BODY (850-BAND)] ── [PATIENT CNVs/MUT] ── [REF GENES (OMIM)] ── [POP (DGV/gnomAD)] ── [LOCI HIGHLIGHTS]
1. Scale Track (Megabase Y-Axis Ruler)
A vertical ruler positioned on the far left displaying genomic positions in Megabases (Mb). Ruler tick intervals automatically scale dynamically based on the current zoom level, transitioning from 10 Mb steps at full chromosome overview down to 0.5 Mb ticks when zoomed into microdeletion candidate regions.
2. Chromosome Body Track (850-Band ISCN G-Bands)
Renders authentic G-banding patterns using standardized ISCN Giemsa stain classification colors and distinct anatomical capsule shapes for p-arms and q-arms:
- gneg: Lightest band shade representing euchromatic, GC-rich, gene-dense regions.
- gpos25, gpos50, gpos75, gpos100: Progressively darker Giemsa-positive heterochromatic, AT-rich bands.
- gvar: Variable heterochromatic regions (such as 1q12, 9q12, 16q12, and Yq12).
- stalk: Acrocentric nucleolar organizer regions (p-arms of chromosomes 13, 14, 15, 21, and 22).
- acen: Centromere pinch region rendered with a distinct red boundary overlay.
3. Patient Track (CNVs and Point Mutations)
Displays patient-specific structural and sequence alterations parsed from family pedigree records or karyotype strings:
- Copy Number Losses (Deletions): Solid red bars spanning exact deleted genomic coordinates.
- Copy Number Gains (Duplications / Trisomies): Solid blue bars marking duplicated segments.
- Loss of Heterozygosity (LOH / UPD): Purple bars highlighting uniparental disomy or LOH regions.
- Point Variants: Colored circular nodes placed at exact variant base-pair coordinates with click detail overlays.
4. Reference Track (OMIM and Local Gene Atlas)
Visualizes reference gene positions along the chromosome. OMIM disease-associated genes and local HGNC atlas entries are rendered as green bars. When zoomed past 5 Mb windows, gene symbols appear with dashed connector lines. High label density is managed by an automatic horizontal staggering system that offsets labels across multiple lanes to prevent text overlap.
5. Population Track (DGV and gnomAD Heatmap)
Displays structural variant density from the Database of Genomic Variants (DGV) and gnomAD. Gray density blocks reflect population variant frequency, with opacity scaling from rare SVs to common SVs (≥ 10%). This allows clinicians to distinguish benign population copy number polymorphisms from rare, clinically significant patient microdeletions or duplications.
6. Loci Highlights Track (Terminator Variant Pins)
Renders highlighted gene loci and patient variants as terminator pins: a source node anchored on the chromosome right edge connects via a dashed leader line to a text callout in the right-hand column.
ACMG 5-Tier Variant Classification and Multi-Lane Label Collision Avoidance
Variant pins displayed on the idiogram canvas are automatically assigned colors according to American College of Medical Genetics and Genomics (ACMG) and Association for Molecular Pathology (AMP) 5-tier classification guidelines:
| ACMG Classification Tier | Category Description | Clinical Significance & Color |
|---|---|---|
| Class 5 | Pathogenic | Solid Red (High Priority Diagnostic Variant) |
| Class 4 | Likely Pathogenic | Dark Red (Likely Disease-Causing Variant) |
| Class 3 | Variant of Uncertain Significance (VUS) | Amber Yellow (Uncertain Clinical Impact) |
| Class 2 | Likely Benign | Teal Green (Likely Non-Pathogenic Variant) |
| Class 1 | Benign | Light Teal (Benign Polymorphism) |
| Highlighted Locus | Manual Locus Search Highlight | Cyan Blue (Curated Locus Interest Pin) |
Intelligent Multi-Lane Label Collision Avoidance
When multiple variants occur in close physical proximity on a chromosome (such as a cluster of mutations in the TP53 or BRCA1 loci), placing labels at exact vertical coordinates can lead to text overlap and visual clutter. Biogistry uses an automated multi-lane staggering algorithm that shifts closely spaced variant labels horizontally across up to 5 distinct lanes. This creates a clean staircase layout while preserving exact leader line connections to chromosome loci.
ISCN Karyotype Lexer, AST Parser, and Fusion Gene Identification
One of the most powerful features of the Biogistry idiogram workbench is the client-side ISCN Karyotype Parser. Free-text karyotype strings entered in patient records are parsed automatically to drive canvas rendering and clinical analysis.
Supported ISCN Karyotype Syntaxes
The parser interprets complex numerical and structural chromosomal anomalies according to ISCN standards:
- Standard Diploid Karyotypes:
46,XX(female default),46,XY(male default). - Aneuploidies and Sex Chromosome Abnormalities:
47,XX,+21(Trisomy 21 / Down Syndrome),47,XY,+18(Trisomy 18 / Edwards Syndrome),45,X(Turner Syndrome),47,XXY(Klinefelter Syndrome). - Terminal and Interstitial Deletions:
46,XX,del(5)(p15)(Cri-du-chat Syndrome),46,XY,del(17)(p12)(HNPP deletion). - Duplications:
46,XX,dup(17)(p12)(Charcot-Marie-Tooth 1A duplication). - Reciprocal and Robertsonian Translocations:
46,XY,t(9;22)(q34;q11)(Philadelphia Chromosome / BCR-ABL1 fusion),45,XX,der(13;14)(q10;q10)(Robertsonian translocation). - Pericentric and Paracentric Inversions:
46,XX,inv(16)(p13.1q22)(Acute Myeloid Leukemia inversion). - Isochromosomes and Ring Chromosomes:
46,X,i(17)(q10)(Isochromosome 17q),46,XX,r(X)(p22q28)(Ring X chromosome).
Automated Fusion Gene and Syndrome Identification
When an ISCN string is parsed, the engine cross-references detected breakpoints against an embedded dictionary of cytogenetic syndromes and fusion genes. For example, parsing a reciprocal translocation t(9;22)(q34;q11) automatically resolves breakpoints at Chromosome 9 (band q34) and Chromosome 22 (band q11), identifying the associated BCR-ABL1 fusion product and Chronic Myeloid Leukemia (CML) diagnostic significance.
Embedded Local HGNC Gene Atlas (19,000+ Genes with Zero Network Latency)
Legacy genetics applications rely on live REST API requests to external servers to resolve gene coordinates. If the user loses internet connection or external servers experience downtime, locus searching breaks completely.
Biogistry resolves this vulnerability by embedding a pre-indexed Local Gene Atlas directly into the client application.
Key Capabilities of the Local Atlas:
- 19,000+ HGNC Gene Symbols: Contains exact GRCh38 base-pair start, end, chromosome, and cytoband assignments for all human protein-coding genes.
- Instant Local Lookups: Gene symbols are indexed in browser memory for instant retrieval. Searching BRCA1, TP53, or CFTR returns exact genomic coordinates without delay.
- Fuzzy Prefix Autocomplete: As clinicians type into the search bar, a debounced auto-suggestion dropdown presents matching HGNC symbols alongside chromosome and cytoband details (for example, typing "BRC" suggests
BRCA1 (Chr 17 · q21.31)andBRCA2 (Chr 13 · q13.1)). - Range Overlap Window Scanning: When panning the chromosome canvas, the engine queries the local atlas to fetch all genes overlapping the current viewport window, enabling smooth semantic zoom without external network calls.
Clinical HGVS Variant Notation Parser and Impact Predictor
In addition to chromosomal band inspection, the idiogram workbench includes an integrated HGVS Variant Parser. Clinicians can input DNA or protein variant strings to evaluate molecular consequences.
HGVS Syntax Parsing Capabilities:
- Prefix Recognition: Handles cDNA (c.), genomic (g.), mitochondrial (m.), protein (p.), and RNA (r.) notations.
- Mutation Types: Classifies substitutions (
G>A), deletions (delTordel1507_1508), insertions (insACT), duplications (dup), and deletion-insertions (delins). - Splice Site Variant Detection: Evaluates cDNA intronic offsets (such as
c.76+1G>Aorc.76-2A>G). Offsets within 2 base-pairs of exon-intron boundaries are automatically tagged as Splice Donor/Acceptor Site Variants (High Risk). - Protein Impact Prediction: Identifies nonsense mutations (premature stop codons
Teror*), frameshifts (fs), in-frame indels, and missense amino acid substitutions.
Single Intake Pedigree Auto-Population
Following Biogistry's core design philosophy, the idiogram workbench is fully integrated with the family pedigree builder.
How Pedigree Data Drives the Idiogram Canvas:
- Patient Selection: Selecting an individual in the Idiogram Inspector automatically retrieves their demographic details, sex, karyotype string, and documented genetic conditions.
- Automatic Variant Pinning: Genetic test results recorded in the pedigree builder (such as a PALB2 c.1592delT mutation) automatically generate ACMG-colored terminator pins on the corresponding chromosome without manual re-entry.
- CNV Overlay Synchronization: Structural abnormalities entered in pedigree notes or karyotype fields (such as
del(17)(p12)) instantly plot solid deletion bars on the patient track of Chromosome 17. - Multi-Patient Cross Comparison: Switch between family members in the inspector dropdown to compare chromosome findings across affected probands, carriers, and unaffected relatives in real time.
- Real-Time Workspace Sync: Modifying a patient's karyotype string or test results in the pedigree builder updates connected idiogram sheets immediately.
Detailed Local Clinical Data Processing Overview
Biogistry processes all chromosome idiogram calculations, ISCN parsing, and locus mapping entirely within your workstation's local browser memory. No patient identifiers or cytogenetic data are transmitted to external cloud servers.
Parameters Processed Locally Per Idiogram Sheet:
| Clinical Category | Specific Data Fields Processed | Primary Clinical Purpose |
|---|---|---|
| Patient Identification | Patient ID, Proband Flag, Biological Sex, MRN | Scoping chromosome views to active pedigree individual |
| Karyotype String | Raw ISCN string (e.g. 47,XX,+21, 46,XY,t(9;22)) |
Driving automated ISCN AST parsing and CNV bar plotting |
| Diploid Count | Total chromosome count, sex chromosome complement | Classifying numerical aneuploidies and sex chromosome syndromes |
| Structural Anomalies | Deletions (del), duplications (dup), inversions (inv) |
Computing structural CNV genomic burden |
| Breakpoint Resolution | Chromosome arm bands (e.g. 9q34, 22q11) | Identifying fusion gene candidates (BCR-ABL1) and OMIM syndromes |
| Cytoband Atlas | 850-band GRCh38 coordinates, Giemsa stain types | Rendering authentic chromosome body and centromere boundaries |
| Gene Coordinate Lookup | HGNC symbol, start/end bp, chromosome ID | Mapping variant pins and reference gene track positions |
| Fuzzy Prefix Search | Query string, debounced symbol autocomplete | Providing instant search suggestions for 19,000+ genes |
| Patient Variant Pins | Variant ID, HGNC gene symbol, mutation notation, bp position | Rendering ACMG-colored terminator pins on chromosome body |
| ACMG Pathology Tier | Class 1 through Class 5 classification codes | Color-coding variant pins and building pathology distribution bars |
| Label Collision Slotting | Pin Y-coordinates, label height, lane width offsets | Staggering overlapping callout labels across up to 5 lanes |
| Scale Coordinate Math | Container height, padding, zoom level, pan Y offset | Calculating exact genomic positions for crisp vector rendering |
| HGVS Molecular Impact | DNA/protein variant string, intronic offsets | Predicting splice donor/acceptor site risks and protein alterations |
| Population SV Density | DGV structural variant frequency, gnomAD SV boundaries | Rendering population SV density heatmaps with proportional opacity |
| OMIM Reference Genes | OMIM disease gene entries, window start/end coordinates | Rendering reference gene bars and semantic zoom labels |
| Minimap Projection | Visible range start/end, chromosome max length | Drawing translucent viewport highlight box on minimap |
| Track Visibility State | Patient, Reference, Population, Loci track flags | Toggling parallel canvas tracks dynamically |
| Legend Generation | Active stains, active CNVs, active ACMG tiers in view | Rendering dynamic collapsible canvas legend |
| Document Export | Vector SVG markup, high-resolution PNG canvas buffers | Exporting publication-ready diagrams for EHR progress notes |
| External DB Linking | Genomic coordinates (chr:start-end), HGNC symbol |
Generating one-click direct links to ClinGen, OMIM, dbSNP, UCSC |
Start Inspecting High-Resolution Chromosome Idiograms Today
Streamline your cytogenetic evaluations with a fast, private, and standardized online chromosome idiogram visualizer. Inspect 850-band G-banded karyotypes, plot ClinVar variants, and analyze ISCN structural anomalies with complete confidence.