Pedigree Chart with Haplotypes: Complete Guide, Crossover Rules, and Software
Learn how to draw and read a pedigree chart with haplotypes. Master chromosome phasing, meiotic crossover detection, and multi-marker linkage analysis in Biogistry.
Key Takeaways
- Phased Genetic Data: A pedigree chart with haplotypes displays linked genetic markers on homologous chromosomes, showing exactly which alleles travel together from parent to child.
- Tracking Disease Transmission: Phased haplotypes help geneticists trace founder mutations, confirm carrier states, and determine whether two mutations sit on the same chromosome (in cis) or opposite chromosomes (in trans).
- Spotting Recombination: Genetic crossovers during meiosis reveal the physical boundaries of disease genes by showing where ancestral chromosomes broke and recombined.
- Native Biogistry Support: Biogistry natively supports interactive haplotype bars, automated phase calculations, and visual crossover markers directly in your browser.
- Privacy by Design: Biogistry executes all calculations locally on your machine, ensuring complete privacy with zero patient data transmission to cloud servers.
What Is a Pedigree Chart with Haplotypes?
A standard pedigree chart records family structure and health conditions using circles and squares. While standard charts show whether a person is clinically affected or unaffected, they do not show the physical chromosomes that carry those conditions.
A pedigree chart with haplotypes (also known as a haplotype pedigree) bridges this gap. It places vertical chromosome bars beneath each person on the family tree. These bars display the exact sequence of genetic markers, such as single nucleotide polymorphisms (SNPs) or short tandem repeats (STRs), located along a specific chromosome region.
In human genetics, humans receive one set of chromosomes from their biological father and one set from their biological mother. A haplotype pedigree visualizes both homologous chromosomes side by side. This lets you watch how genetic material moves through multiple generations.
| Pedigree Element | Visual Position | Clinical Role & Content |
|---|---|---|
| Node Symbol | Top Center | Circle (female) or square (male) showing clinical disease status |
| Paternal Bar (Left) | Beneath Shape | Chromosome segment and alleles inherited from biological father |
| Maternal Bar (Right) | Beneath Shape | Chromosome segment and alleles inherited from biological mother |
| Marker Locus Rows | Top to Bottom | Linked DNA markers ordered by physical chromosome position |
Why Use Haplotypes Instead of Basic Genotypes on a Pedigree?
Many clinicians and students ask: why not just write basic genotypes like Aa or Bb under each family member?
Basic genotypes are unphased. An unphased genotype tells you what alleles a person carries, but it does not tell you how those alleles are grouped on their chromosomes.
Example: The Phase Problem in Clinical Genetics
Suppose a patient tests positive for two pathogenic gene variants in the CFTR gene, which causes cystic fibrosis: Variant 1 (F508del) and Variant 2 (G542X).
- Scenario A (In Trans - Recessive Disease): The patient received F508del on the maternal chromosome and G542X on the paternal chromosome. Because both gene copies are broken, the patient has cystic fibrosis.
- Scenario B (In Cis - Healthy Carrier): Both variants sit together on the same maternal chromosome, while the paternal chromosome is completely normal. The patient still has one healthy copy of the gene and is only an unaffected carrier.
An unphased genotype report simply lists both variants. A phased haplotype pedigree chart shows which parent passed down each variant. This gives genetic counselors and physicians the certainty they need to make a clinical diagnosis.
Visualizing Haplotypes: Two Clinical Examples
Example 1: Autosomal Dominant Linkage and Crossover
Below is a three-generation pedigree chart displaying phased haplotypes across a disease-linked chromosome region.
Notice how the paternal chromosome is colored blue and the maternal chromosome is colored red. In Generation III, an informative meiotic crossover (recombination event) occurs between Marker 2 (BRCA1) and Marker 3 (Locus 2).
Figure 1: Three-generation Autosomal Dominant pedigree chart with phased haplotypes and left-hand Marker Rail (Locus 1, BRCA1, Locus 2). In Generation III, individual III-1 inherits a recombinant maternal chromosome. A meiotic crossover occurred between BRCA1 and Locus 2, swapping the bottom segment with the maternal green block.
Example 2: X-Linked Recessive Haplotype Linkage (Duchenne Muscular Dystrophy)
X-linked recessive disorders highlight the clinical power of haplotype tracing. Males carry only one X chromosome (XY), meaning any male who inherits the maternal risk haplotype is affected. Females have two X chromosomes (XX) and can be asymptomatic carriers.
Below is a pedigree tracing the transmission of three linked markers flanking the DMD gene on chromosome Xp21. Notice how Mother II-1 passes the high-risk red haplotype to her affected son III-1.
Son III-2 inherits a recombinant X chromosome. Because the crossover breakpoint occurred distal/downstream to the DMD locus (between the DMD gene and Microsatellite 2 DXS997), he retained the functional wild-type allele (D) alongside the proximal marker (5) from his maternal grandfather's track, thereby avoiding the disease.
Figure 2: X-Linked Recessive haplotype pedigree for Duchenne Muscular Dystrophy (DMD) with left-hand Marker Rail (DXS1214, DMD, DXS997). Son III-1 inherits the full high-risk maternal haplotype (red bar with del*). Son III-2 inherits a recombinant X chromosome: because the crossover breakpoint occurred distal/downstream to the DMD locus (between the DMD gene and Microsatellite 2 DXS997), he retained the functional wild-type allele (D) alongside the proximal marker (5) from his maternal grandfather's track, thereby avoiding the disease.
The Phase Problem in Clinical Diagnostics: Resolving Cis vs. Trans
In high-throughput clinical genomics, Next-Generation Sequencing (NGS) panels and Whole Exome Sequencing (WES) sequence genomic DNA by fragmenting it into short reads (typically 150 to 300 base pairs).
While short-read sequencing excels at detecting single-nucleotide variants and small indels, it is physically incapable of connecting two variants separated by more than a few hundred base pairs. Such test reports return unphased variants:
Without phasing, a physician cannot tell whether this patient has Cystic Fibrosis or is an unaffected carrier:
| Allelic Configuration | Physical Arrangement | Parental Transmission | Clinical Health Outcome |
|---|---|---|---|
| In Trans (Compound Heterozygous) | One mutation on paternal chromosome; other mutation on maternal chromosome. | Both biological parents are asymptomatic carriers of distinct variants. | Affected Patient. Both copies of the gene are disrupted, resulting in clinical disease manifestation. |
| In Cis (Co-inherited Alleles) | Both mutations sit together on the same physical chromosome. | One parent carries both mutations; the other parent contributes a completely normal chromosome. | Unaffected Carrier. The patient retains one fully functional wild-type allele and remains healthy. |
Both homologous chromosomes carry an inactivated copy. Zero functional protein produced → Recessive Disease Manifests.
Both mutations sit on the same parental chromosome. The opposite chromosome is fully intact → Unaffected Asymptomatic Carrier.
By drawing a pedigree chart with haplotypes and genotyping both biological parents (a clinical trio), genetic counselors trace the transmission of each marker block. If the mother passes Variant 1 and the father passes Variant 2, the diagnosis of compound heterozygosity in trans is confirmed with 100% certainty.
Chromosome Phasing Methodologies: Trios vs. Long-Read Sequencing vs. Statistical Phasing
Modern medical genetics uses three distinct methodologies to establish chromosome phase:
| Phasing Methodology | Technical Mechanism | Clinical Strengths | Key Limitations |
|---|---|---|---|
| Pedigree-Based Trio Phasing (Gold Standard) | Analyzes Mendelian transmission of flanking markers from parents to offspring. | 100% Deterministic. No algorithmic guesswork; directly confirms biological transmission. | Requires DNA samples from biological parents or multi-generation relatives. |
| Single-Molecule Long-Read Sequencing | PacBio HiFi or Oxford Nanopore reads that span 15 kb to >100 kb in a single continuous molecule. | Directly reads multiple variants on the same physical DNA strand without needing family members. | Higher sequencing cost per sample; requires high-molecular-weight (HMW) intact DNA. |
| Statistical / Population Phasing | Software tools (SHAPEIT4, Beagle, Eagle) compare unphased variants against large population haplotype reference panels (TOPMed, 1000 Genomes). | Works on isolated individual samples without relatives or specialized sequencing. | Probabilistic, not diagnostic. Fails on rare familial variants, de novo mutations, and novel indels. |
Because clinical diagnostic guidelines require definitive proof before initiating irreversible treatments or making reproductive decisions, pedigree-based trio linkage remains the clinical gold standard.
LOD Scores (Z) and Genetic Linkage Analysis in Multi-Generational Pedigrees
When researchers and geneticists investigate the genetic basis of an unmapped hereditary disorder, they construct multi-generational haplotype pedigrees to perform linkage analysis.
Linkage analysis relies on a biological truth: genes or markers located close together on the same physical chromosome tend to be inherited together during meiosis. The probability of a meiotic crossover occurring between two loci is proportional to their physical distance, defined as the recombination fraction (θ):
- θ = 0.0 indicates complete linkage (zero recombination).
- θ = 0.5 indicates independent assortment (the loci are on different chromosomes or very far apart).
To prove whether an observed co-inheritance pattern is statistically genuine or merely coincidental, geneticists calculate the LOD Score (Logarithm of the Odds):
Where:
- L(θ) is the likelihood of observing the family pedigree data if the marker and disease gene are linked at recombination distance θ.
- L(0.5) is the likelihood of observing the family pedigree data if the marker and disease gene are completely unlinked.
Clinical LOD Score Thresholds
| LOD Score (Z) | Statistical Odds | Clinical & Scientific Interpretation |
|---|---|---|
| Z ≥ +3.0 | ≥ 1,000 : 1 in favor of linkage | Confirmed Genetic Linkage. Universally accepted threshold in medical genetics proving the disease gene is linked to the marker. |
| -2.0 < Z < +3.0 | Inconclusive | Ambiguous Linkage. More informative meioses (additional family members) are required to reach statistical power. |
| Z ≤ -2.0 | ≤ 100 : 1 against linkage | Linkage Excluded. Proves definitively that the disease gene does not reside within this chromosomal region. |
Haplotype pedigree charts are essential for calculating LOD scores because they clearly delineate informative meioses: meioses in which an investigator can unequivocally distinguish between a recombinant and a non-recombinant gamete.
Preimplantation Genetic Testing for Monogenic Disorders (PGT-M) & Karyomapping
One of the most critical clinical applications of haplotype pedigrees today is in reproductive medicine during In Vitro Fertilization (IVF) with Preimplantation Genetic Testing for Monogenic Disorders (PGT-M).
When a couple at high risk for passing on a severe genetic disorder (such as Spinal Muscular Atrophy, Huntington disease, or Cystic Fibrosis) undergoes IVF, embryologists biopsy 5 to 8 trophectoderm cells from a day-5 blastocyst embryo.
The Allele Dropout (ADO) Hazard
In single-cell molecular analysis, minute quantities of DNA must undergo Whole Genome Amplification (WGA). This process suffers from an inherent technical artifact called Allele Dropout (ADO):
- ADO occurs in 10% to 20% of single-cell PCR reactions when one of the two alleles fails to amplify.
- If the pathogenic mutant allele drops out, an affected embryo will test falsely normal, leading to the transfer of an affected pregnancy.
- If the normal allele drops out, a healthy carrier embryo will test falsely affected and be discarded.
- Sample Input: Single-cell biopsy DNA (5–8 trophectoderm cells)
- Assay Target: Familial mutation locus only
- Failure Risk: PCR Allele Dropout (ADO) occurs in 10%–20% of reactions
- Clinical Failure: Mutant allele drops out → Affected embryo transferred (False Normal)
- Sample Input: Single-cell biopsy DNA (5–8 trophectoderm cells)
- Assay Target: 15–30 flanking polymorphic SNP markers
- Built-in Redundancy: Even if the mutation locus drops out, flanking markers amplify cleanly
- Clinical Certainty: Entire risk block tracked → >99.5% diagnostic accuracy
How Haplotype Linkage Solves ADO
To eliminate diagnostic errors caused by ADO, IVF clinics use Karyomapping and Haplotype Linkage Pedigrees:
- Before IVF begins, the clinical lab genotypes both prospective parents and a reference relative (such as an affected child or grandparents) across hundreds of polymorphic SNP markers flanking the disease locus.
- The lab builds a phased haplotype pedigree that identifies the exact "fingerprint" of the high-risk chromosome track.
- When testing embryo biopsies, clinicians do not rely on the single mutation site alone; they test 10 to 30 flanking markers above and below the gene.
- Even if the mutation locus suffers complete Allele Dropout, the surrounding linked haplotype confirms whether the embryo inherited the parental risk chromosome, providing diagnostic accuracy above 99.5%.
Advanced Haplotype Engineering in Biogistry
Biogistry was engineered specifically to solve the data and visualization bottlenecks of clinical molecular genetics:
- Interactive Marker Rail: Biogistry's native canvas displays a synchronized, scalable Marker Rail on the margin of your family tree, labeling loci by physical position (base pairs) or genetic map distance (centimorgans).
- Founder Color Inheritance Engine: Chromosome blocks assigned to ancestral founders automatically propagate through descendants with consistent color tracks, making parental origin visible across four or more generations.
- 1-Click Recombination Breakpoint Tool: Clinicians can click between any two marker loci to introduce a meiotic crossover. The software automatically splits the chromosome bar with crisp two-tone shading and updates downstream inheritance.
- Phase Swap Validation: If a user attempts to swap phases or reassign an allele, Biogistry's validation engine verifies the proposed change against parental genotypes, highlighting Mendelian violations in real time.
- Risk Allele Segregation Scoring: Biogistry's risk assessment engine calculates segregation across all genotyped family members, classifying candidate haplotypes as confirmed, candidate, or ambiguous with automated visual flag badges.
- Zero-Trust Local Privacy: All chromosome calculations, pedigree routing, and image rendering occur exclusively within your web browser's local sandbox memory. Patient genomic data is never transmitted to cloud servers.
4 Key Clinical Uses of Haplotype Pedigree Charts
1. Pinpointing Disease Genes Through Linkage Analysis
When geneticists hunt for an unknown disease gene, they test polymorphic markers across the genome in large families. If a specific haplotype block always shows up in affected relatives and never in healthy relatives, the disease gene must reside within that chromosomal block.
2. Detecting Meiotic Recombination Breakpoints
Chromosomes do not stay static across generations. During meiosis, homologous chromosomes exchange segments in a process called crossing over.
When a crossover occurs near a disease locus (as shown in Figure 1 for individual III-1 and Figure 2 for individual III-2), it narrows the candidate region. By tracking which segments stay with the disease trait, researchers identify the exact boundaries of the gene.
3. Tracking Founder Mutations in Isolated Populations
Certain genetic conditions (such as specific BRCA1 Ashkenazi founder mutations or HBB beta-thalassemia mutations) originate from a common ancestor. By building pedigree charts with haplotypes, clinical geneticists identify the ancestral chromosomal signature passed down through dozens of generations.
4. Direct Preimplantation and Prenatal Diagnosis
When a direct mutation test is ambiguous or technically challenging, clinicians use linked flanking markers on a haplotype pedigree. This confirms whether an embryo or fetus inherited the high-risk parental chromosome segment.
The Problem with Legacy Haplotype Tools
For over two decades, genetics clinics and research labs have struggled with outdated software tools:
- HaploPainter: Built in 2005 using Perl/Tk. Installing it on modern Windows or macOS requires running complex terminal commands, installing deprecated libraries, and troubleshooting file path errors. It has no native cloud support and cannot edit family trees interactively.
- GeneMarker: Powerful, but requires a dedicated local desktop workstation, complex dongles, and extensive training.
- Cyrillic & SimWalk2: Abandoned over fifteen years ago. They will not run on modern 64-bit operating systems without emulation.
- Manual PowerPoint or Illustrator: Many researchers end up drawing colored boxes by hand. This process takes hours, invites human error, and fails standard medical data audits.
Why Biogistry Is the Modern Choice for Haplotype Pedigrees
Biogistry was built from the ground up to modernize genetic family trees. Here is how it compares directly to traditional tools:
| Feature / Capability | Legacy Tools (HaploPainter, Cyrillic) | Desktop Suites (GeneMarker) | Manual Drawing (PowerPoint) | Biogistry |
|---|---|---|---|---|
| Setup & Installation | Complex Perl scripts and old dependencies | Heavy multi-gigabyte installer | No installation (office tool) | Zero install. Runs instantly in modern web browsers. |
| Interactive Canvas | Static post-script rendering only | Clunky desktop interface | Manual drag-and-drop shapes | Fluid, real-time interactive canvas with smart routing. |
| Privacy & Security | Local desktop only | Local desktop only | Unencrypted local files | 100% Local-First. Zero patient data sent to servers. |
| Crossover Editing | Text-based script parameters | Manual menu clicks | Manual drawing of split boxes | 1-Click visual phase swapping and recombination. |
| Export Formats | Low-res bitmaps or PostScript | Proprietary report formats | Slides or image exports | Lossless Vector SVG, 4K PNG, PDF, and FHIR export. |
Step-by-Step Guide: How to Create a Pedigree Chart with Haplotypes in Biogistry
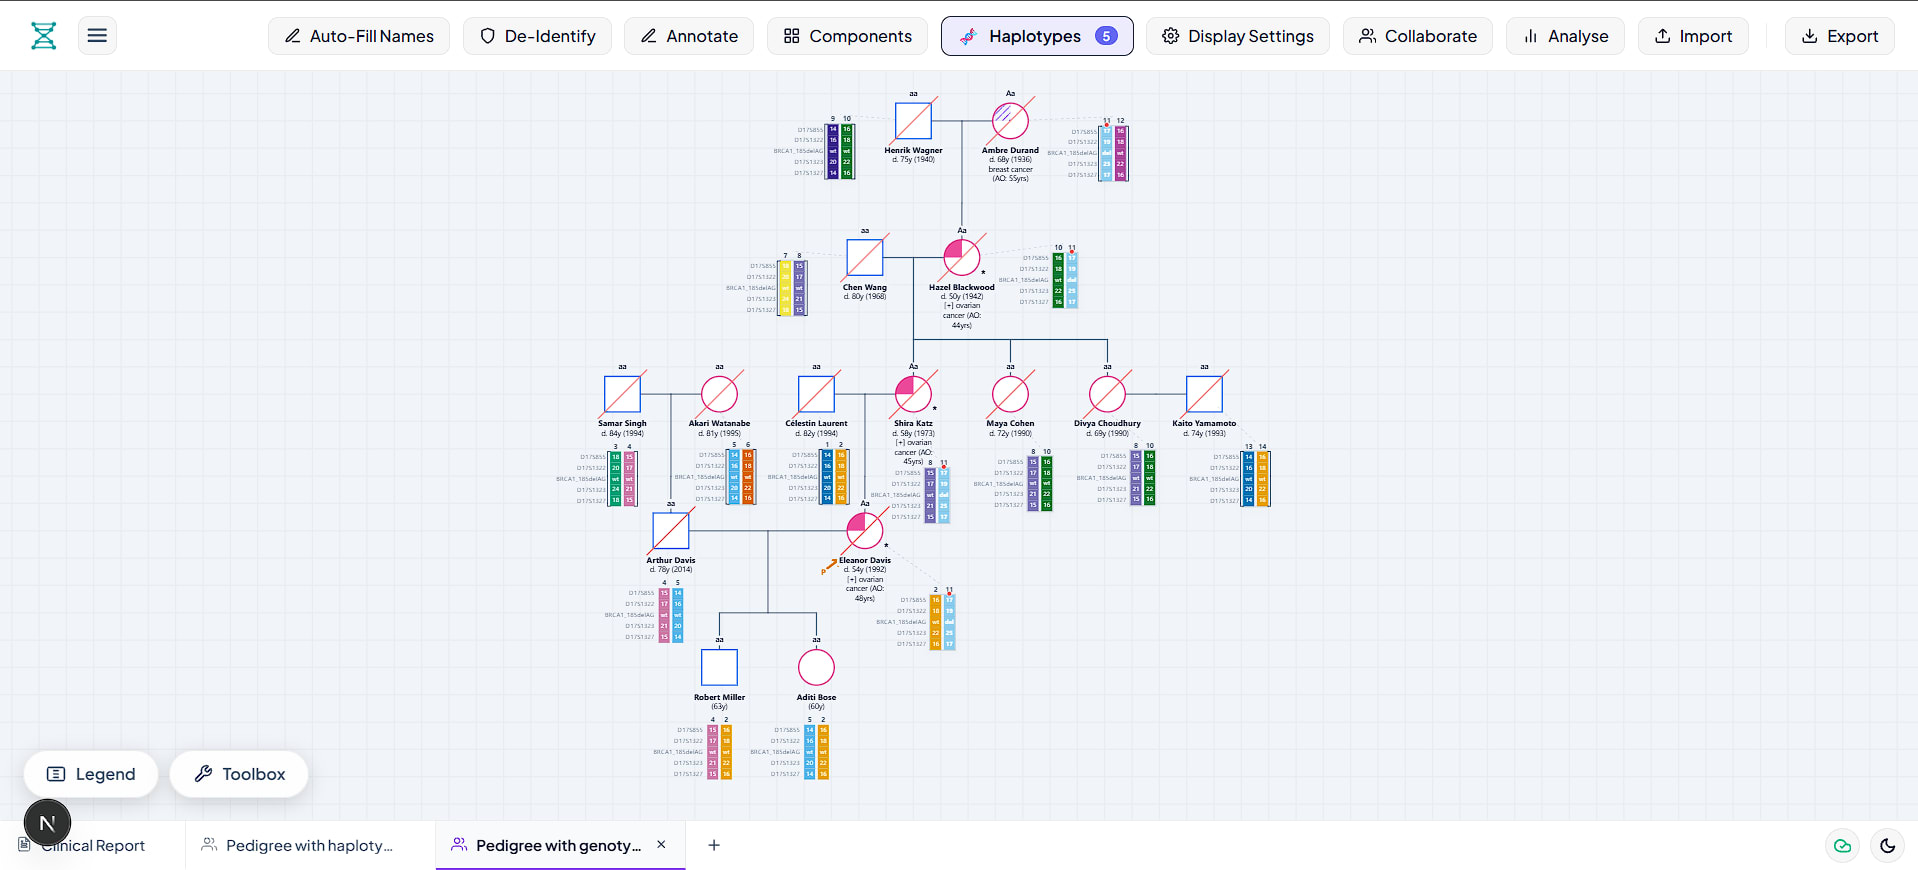
Creating a publication-ready haplotype pedigree in Biogistry takes only a few minutes. Follow these simple steps:
Step 1: Open Biogistry and Choose Haplotype Annotation Mode
- Open the Biogistry Pedigree Builder.
- When creating a new file or sheet, select 🧬 Haplotypes Mode.
- If you already have an existing family tree on your canvas, you do not have to redraw it. Simply click Display Settings in the top bar and switch the annotation mode to Haplotypes.
Step 2: Set Up Your Genetic Marker Loci
- Click the 🧬 Haplotypes button in the top navigation bar to open the Haplotype Configuration Modal.
- Click + Add Locus to define the genetic markers in your chromosome region (for example: D17S855, BRCA1, D17S1322).
- Assign a distinct color to each parental chromosome track so you can follow maternal and paternal inheritance at a glance.
Step 3: Assign Marker Alleles to Family Founders
- Select any family founder on your canvas.
- In the Haplotype Manager table, enter the observed allele numbers or letters for the left (paternal) and right (maternal) chromosomes.
- Biogistry immediately renders vertical chromosome bars underneath the individual's node on your canvas.
Step 4: Trace Inheritance and Mark Recombination Events
- For children, assign the inherited parental chromosome blocks.
- If a meiotic crossover occurred, use the Phase Swap / Crossover Tool to split the chromosome bar at the exact marker locus where recombination happened.
- Biogistry automatically updates the visual bar with two-tone colors to display the crossover breakpoint clearly.
Step 5: Export for Publication or Clinical Charts
- Click Export in the top right corner.
- Choose Vector SVG for crisp, scalable figures suitable for medical journals and research papers.
- Choose Clinical PDF or High-Res PNG to embed directly in patient electronic health records.
Privacy First: Why Local-First Architecture Matters in Genetics
Genetic marker data is the most sensitive health information that exists. An individual's DNA reveals their personal disease risks and exposes genetic secrets about their parents, siblings, and children.
Most modern web applications send every mouse click and form entry to remote cloud databases. If a cloud server experiences a data breach, identifiable genomic information can be compromised, leading to severe HIPAA and GDPR violations.
Biogistry solves this problem by using a local-first, browser-native architecture:
- Zero Cloud Storage of Patient Data: All pedigree calculations, layout engines, and haplotype rendering run directly in your computer's browser memory using WebAssembly and HTML5 Canvas.
- No Telemetry or Server Storage: Biogistry never sends patient names, family relationships, or genotype results to external servers.
- Air-Gap Friendly: Because Biogistry runs entirely in the browser, hospital genetics departments can use it in restricted clinical networks without exposing internal data to the internet.
Frequently Asked Questions (FAQ)
What is the difference between a genotype and a haplotype?
A genotype lists the pair of alleles present at a single gene locus without specifying which chromosome they sit on (for example, Aa). A haplotype is a linked collection of alleles across multiple loci located on the exact same physical chromosome.
Can I switch between standard medical pedigrees, genotypes, and haplotypes?
Yes. In Biogistry, you never have to redraw your family tree. You can toggle between Standard mode, Genotypes mode, and Haplotypes mode with one click. The pedigree tree remains intact while the labels beneath each person update automatically.
How many marker loci can I display beneath each person?
Biogistry supports anywhere from 1 to more than 20 linked marker loci along a chromosome track. The canvas automatically scales font sizes and bar heights to keep your chart readable and clean.
What file formats can I export from Biogistry?
You can export your haplotype pedigree as a vector SVG file, high-resolution PNG image, print-ready PDF, standardized GEDCOM family tree file, or HL7/FHIR clinical bundle for health record integration.
Start Drawing Haplotype Pedigrees in Biogistry
You no longer need to rely on outdated command-line scripts or manual illustration tools. With Biogistry, you get an intelligent, clinical-grade pedigree builder with native haplotype support that is fast, customizable, and completely private.